A recent article published in Nature Publishing’s Scientific Reports, caught my eye, as a news story was recently published detailing how this paper is controversial and has drawn strong criticism from the scientific community.
I thought I would describe the paper, and why its strong criticism by fellow scientists is justified, but I also want to celebrate the paper, since its inclusive into the peer review literature has ignited debate on a topic that has long been thought well understood, but more likely forgotten and not well taught as it should. The editorial staff at Nature Publishing let this bizarre paper slip by. The paper highlights our shared ignorance on this topic, and I thought it would be good to discuss it.
I want to celebrate this scientific debate, by explaining why it is incorrect.
You can read a copy of the paper here, https://www.nature.com/articles/s41598-019-45584-3 as well as a lengthy discussion from comments, and the authors here: https://pubpeer.com/publications/3418816F1BA55AFB7A2E6A44847C24
A criticism of Zharkova et al.’s 2019 paper “Oscillations of the baseline of solar magnetic field and solar irradiance on a millennial timescale.”
This is written for a general non-science audience from a geologist/paleontologist who studies past climate change in Earth’s history. I don’t claim to be an expert in this field, but with a little thought we can figure out where this paper goes wrong.
Let’s look at what the paper claims:
1) In additional to the well documented 11.1-year cycle of sun spot activity, the paper claims there is also a 350–400-year solar cycle, which is predicted to demonstrate decreasing sun spot activity in the next 50 years.
2) Despite a predicted decrease in sun spot activity in the next 50-100 years, the authors argue that there will be increasing global terrestrial temperatures due to changes in the elliptical yearly orbit around the sun. (the authors define this as “inertial motion about the barycenter of the solar system”).
3) The changes in sun spot activity and Earth’s elliptical yearly orbit around the sun will lead to an increase in average global temperatures of 2.5 Celsius by 2600 CE.
What are sun spots?
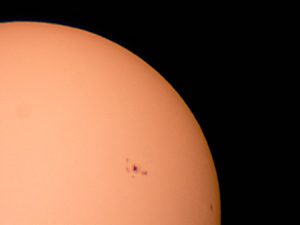
Sun Spots are cooler regions of the Sun’s photosphere, which are a few thousand degrees Kelvin cooler than the surrounding gas. These Sun Spots have been observed for hundreds of years, and follow an 11-year cycle, related to the Sun’s magnetic orbit around its core. Sun spots appear just above and below the Sun’s equator in a clear 11-year burst of activity. Sun flares during this enhanced Sun Spot activity result in charge particles hitting the outer most atmosphere of Earth, resulting in a colorful Aurora in the night sky near the Earth’s poles during these events. Sun spot activity is closely monitored, since it can affect Earth orbiting satellites (see http://www.solarham.net/).
Measurements of solar irradiance hitting the upper atmosphere, measured by NASA satellites Nimbus 7 (launched in 1978) and Solar Maximum Mission (launched in 1980), among others since then, including the most recent satellite NASA’s TSIS-1, [check out this NASA video, featuring cheesy music] https://youtu.be/GKLU8YHSnlc

International Space Station with TSIS-1 Installed
All these satellites show slight increases of total solar irradiance striking the upper atmosphere during periods of sun spot activity. This is due to faculae, which are brighter regions that accompany sun spot activity, giving an overall increase of solar irradiance; however when darker sun spots dominate over the brighter faculae regions there has also been brief downward swings of lower solar irradiance during high sun spot activity as well. Measured solar irradiance of the upper atmosphere since these satellites were launched in 1978 has shown that the sun’s energy striking the Earth’s upper atmosphere only varies by about 5 watts/meter2 (Willson & Mordvinov, 2003: Geophyscial Research Letters). This is equivalent to increasing the brightness of the sun by adding a small 2.5 watt light bulb, as seen from 1 meter away. Or between 1363.423 and 1356.656 watts/meter2 from observed satellite data (see http://lasp.colorado.edu/lisird/)
Is Sun Spot Activity Decreasing?
Historical records of sun spot activity exist going back to the 1600s, when astronomers would count the number of dark spots observed on the sun, as projected through a pin-hole. The number of sun spots observed was recorded, and by 1700 astronomers begin to observe an 11-cycle of activity. In 1848, a standard method of counting sunspot numbers was employed at the Zurich Observatory by Johann Rudolph Wolf (1816-1893). So, the number of sun spots was not standardized until then. The earlier data from 1645 to 1714 recorded few sun spots, and astronomers have argued whether this is due to limited measuring standards of the time, or represent a true period of decreased activity called the Maunder Minimum. The highest number of observed sun spot activity was found in 1958 (See Solanki & Krivova, 2011: Science “Analyzing Solar Cycles”).
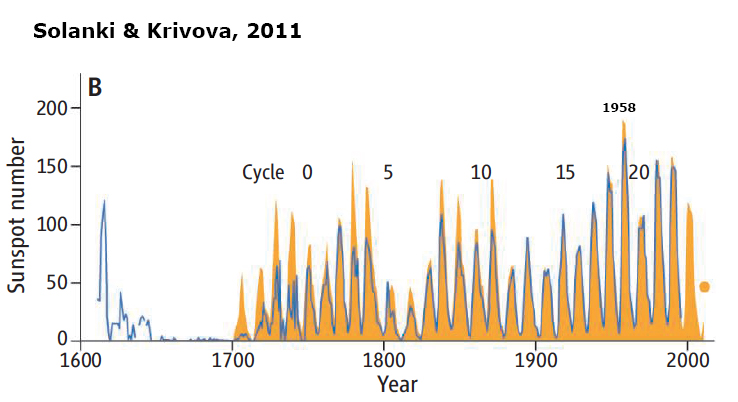
Figure from Solanki & Krivova, 2011
Scientists have used the record of the isotopes of 10Be as well as 14C as a proxy for sun spot activity prior to 1645, and have suggested longer cycles between sun spot activity on a grander 100-plus year scales, however, many of these longer cycles have not been well document, nor well accepted by scientists.
It is important to note that a decrease in sun spot activity would only decrease the variability of the sun’s irradiation hitting the upper atmosphere, with fewer days reaching highs close to 1363 watts/meter2. This would decrease solar irradiation incoming into the upper atmosphere by less than 0.3%.
Ice core records of climate show proposed grand 100-plus solar cycles have a limited or no effect on climate through time.
It is important to note that many scientists that study sun spot activity don’t fully agree that there is a 400, or 350, or 240-year or longer cycle in sun spot activity, as the evidence is still a little shaky. However, there is unanimous acceptance of an approximate 11-year cycle in sun spot activity, as shown in the above figure.
So why is the paper arguing for an increase of global temperatures of 2.5 degrees Celsius?
This is the odd part of the paper, the authors are claiming that despite a hypothesized decrease in sun spot activity in near future years, there will be a major increase in terrestrial temperatures in the next 600 years. A half a degree every century.
The authors argue that there will be changes in the inertial motion about the barycenter of the solar system, which will over-ride the decrease in the predicted solar irradiation. What does this mean? And why would it cause the Earth to increase in temperature?
How does the Earth rotate around the Sun?
During the yearly orbit around the sun, the Earth travels in a slight elliptical orbit around the sun.
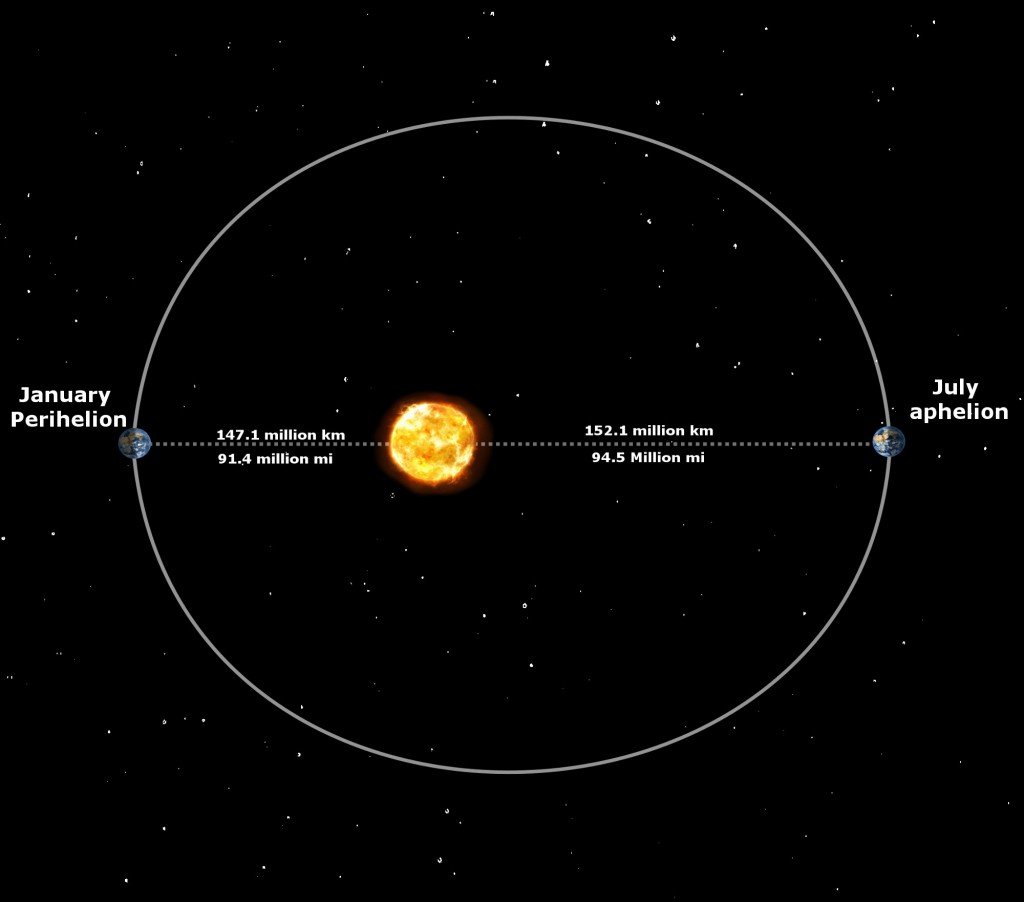
The Earth is closest to the sun at the perihelion (which occurs around January 4th), and furthest from the sun at the aphelion (which occurs around July 5th). Mathematically we can define a term for ellipses called eccentricity. When eccentricity is zero, the ellipse will be a perfect circle; the difference between the distances across the widest part of the circle and the narrowest part of the circle will be zero. If the circle is actually an ellipse, rather than a perfect circle, the difference between the widest part of the ellipse and the narrowest part of the ellipse will be greater than zero; we call this difference eccentricity.
To measure eccentricity of the Earth’s orbit around the sun requires that we observe the daily path of the sun’s shadow for a full year and determine the precise time it reaches its highest point in the sky (shortest shadow each day). The difference from the local noon time and when the sun is observed at the highest point in the sky will shift slightly throughout the year. This is because the Earth’s path relative to the Sun will have slight differences in velocity as Earth moves around the Sun over a year along this elliptical path. Sometimes the Earth will be slower, during the narrow width days, and sometime faster during the wider width days of the year. The differences in local noon time and observed solar path can be used to determine Earth’s eccentricity, which is currently 0.0167. It is nearly a circle, but not exactly.
Another way to measure the Earth’s eccentricity is to measure the width and shape of the analemma of the Sun each day of the year. This is the position in the sky each day that the sun reaches its highest point. The shape of the analemma is dependent on the elliptical path of the Earth around the Sun, and will result in a figure-8 path for eccentricity less than 0.045; however, as Earth’s eccentricity approaches 0.045 or greater it will become more tear-drop in shape with no intersection.
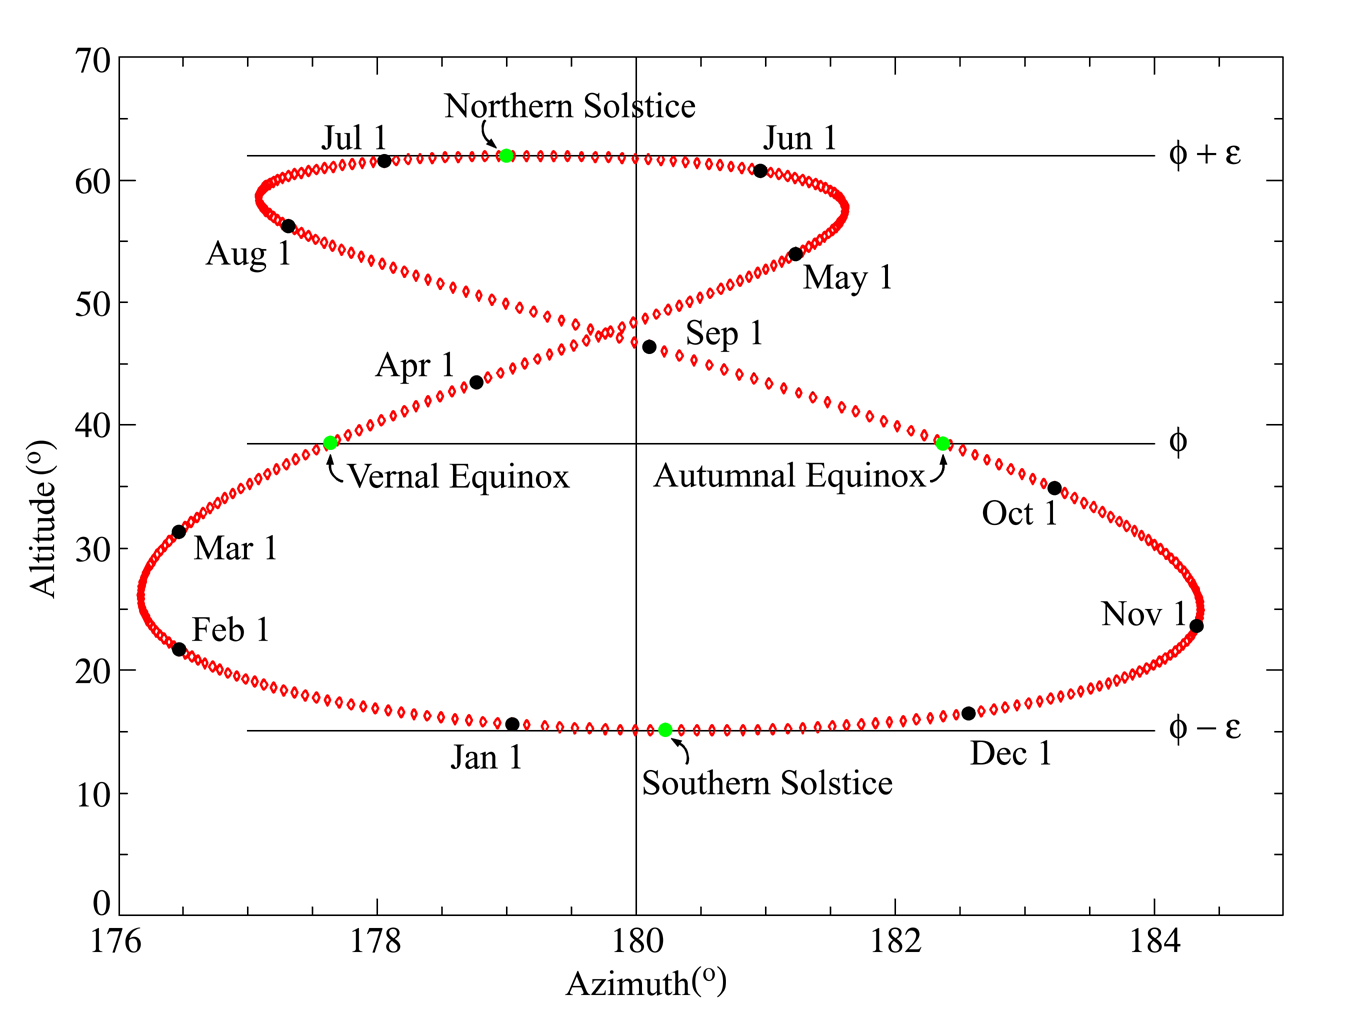
Figure: The Current Yearly Analemma or highest point of the Sun’s position in the sky each day of the year (from wikipedia).
Earth’s eccentricity oscillates between 0.057 and 0.005, which means that sometimes Earth will be more circular in its path around the sun, and sometimes more elliptical. When the eccentricity is greater, Earth will be further and closer to the Sun during those points in its orbit. In the Northern Hemisphere, the perihelion (closest to the sun) occurs in the winter, resulting in a milder winter, while the aphelion (furthest from the sun) occurs in the summer, resulting in a cooler summer (and opposite in the Southern Hemisphere). When eccentricity is less, the winters and summers will be cooler and warmer, respectively, in the North Hemisphere, but the opposite in the Southern Hemisphere. However, the distance to the sun oscillates only several thousand kilometers, and has a fairly mild effect on climate. The eccentricity cycles between its extremes every 92,000 years, although it oscillates in an odd pattern because these changes in eccentricity are due to the interaction of Earth with other planets in the solar system, particularly Jupiter, Saturn, Uranus and Neptune, which pull and tug at Earth, stretching Earth’s yearly orbital path around the sun.
The authors are invoking something called the barycenter of the solar system, rather than defining the sun’s center as the central point of the solar system. A barycenter is defined as the center of mass of two or more bodies in orbit with each other. When the two bodies are of similar masses, the barycenter will generally be located between them and both bodies will orbit around it. However, since the sun is much larger than the planets in the solar cycle, the barycenter is a moving point orbiting the sun’s core. This is equivalent to eccentricity, but rather than defining it in reference to the Earth, it is in reference to the Sun’s position (i.e. they view incorrectly that the sun is moving closer and farther from the Earth, rather than the path of Earth moving in a more or less elliptical orbit around the sun). This is an odd way of viewing the solar system if you are interested in the effect of Earth’s yearly orbit on terrestrial temperatures. This is because the same planetary gravitational forces would also be working on Earth, as it would the Sun.
Orbital calculations utilizing eccentricity were first worked out by Milutin Milanković in his in 1941 book published in German, entitled Kanon der Erdbe-strahlung und seine Anwendung auf das Eiszeitenproblem (The Canon of the Earth’s Irradiation and its Application to the Problem of Ice Ages). Milanković mathematically predicted oscillations of Earth’s climate and long-term cycles that have been verified in ice core data, and ancient sedimentary rocks, which show these long-term cycles in Earth’s orbit, which today we call Milanković Cycles. What makes Milutin Milanković stand out is that he also looked at the precession of dates when the perihelion (which occurs around January 2th in 2019), and the aphelion (which occurs around July 5th in 2019), change.
Earth’s precession or wobble in the orbit results in these dates to shift over about 24,000 years, hence in the future, the perihelion would occur the Northern Hemisphere’s summer making it warmer, and at the same time the aphelion would occur in the Northern Hemisphere’s winter, making it colder. When this happens there is a higher seasonal variability in climate, not a net increase or decrease in temperature. Note that when this happens, ice and snow formed during these colder winters can cause a positive-feedback into colder climates due to albedo, the reflection of sunlight back into space. White (a more reflective surface) snow and ice covering more of the Earth’s surface, would reflect more of the sun’s light back into space. This is what caused the last major ice ages.
So what happens to solar irradiation on days of the year that the Earth is at the perihelion (closest to the sun), and days of the year that the Earth is at the aphelion (furthest from the sun)?
This requires that we subtract out the influence of sun spot activity. To do this we can do something called a regression analysis. We will graph all the calibrated solar irradiation data on the Y-axis and number of sun spots on the X-axis, the more sun spots, the higher the solar irradiation will be, and the data will fall in a diagonal line, called a regression line.
We can make a scientific hypothesis!
Dates that fall on the perihelion should be found above this regression line, while dates that fall on the aphelion will be below this regression line. The distance between these points will give us a sense how much effect the Earth’s eccentricity has on solar irradiation.
To get data is just a click away, and I visited http://lasp.colorado.edu/lisird/ The LASP Interactive Solar Irradiance Data Center, where I can download individual data, as well as Sun Spot data.
I’m going to use the EMPIRE total solar irradiance, time series which provides data going back to 1947. However, I could run this analysis on individual data from each satellite.
The dates I’ve used are from 2/14/1947 to 5/30/2017, so 70 years of data. Note that the earlier data has greater uncertainty. I also downloaded the American Relative Sunspot Number, daily average for those same dates.
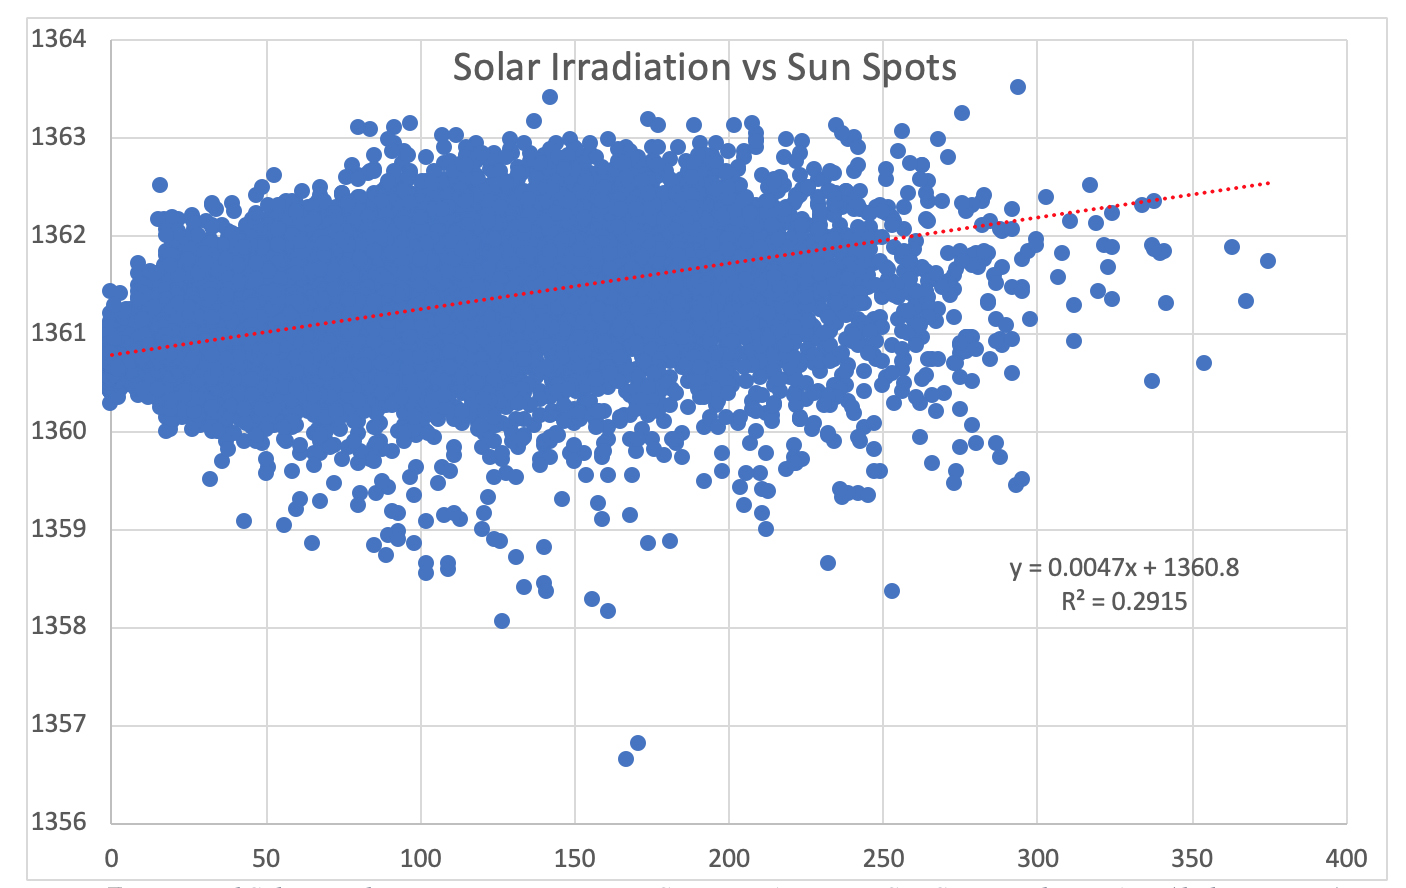
Figure: Measured Solar Irradiation in Watts per Meter Square Y-Axis verse Sun Spot Number X-Axis (daily averages)
This plot is a giant data cloud, but notice that the it trends upward, as the number of sunspots increase so too does the solar irradiation, but it also varies more as well. We can draw a line using graphic program trend line in excel that minimizes the distance between data points, and determine the linear formula. [note that above 300 sun spots in a day, the data shows fewer higher values than the regression line predicts, likely because sun spots start to out number the faculae or bright spots, and the irradiation is less than predicted]
The linear formula based on this giant cloud of data is Y=0.0047x + 1360.8
This means that for each sun spot, on average the solar irradiation increases 0.0047, from a base of 1360.8 watts per meter square. This means we can subtract 0.0047 x the number of sun spots from the solar irradiation to get a value that subtracts, or nullifies the effect sun spots have on solar irradiation.
Now we can compare this number, with the daily orbital distance between the Earth and Sun.
This is a little challenging, but we will work through it.
A simple solution (although not super precise, is to use a simple formula.
𝑟=1−0.01672 x cos(0.9856(day-4))
r is the radius measured in AU (astronomical units),
0.01672 is the current eccentricity, and
0.9856 is 360/365.256363 which converts degrees into days (an orbit around the Sun is 365.256363 days long),
and the 4 is set as Jan. 4th or the perihelion, which was actually on Jan. 2nd in 2019.
This also does not consider the pull of Jupiter and the outer planets on the Sun and Earth, luckily the JPL (Jet Propulsion Laboratories) has published high precession geocentric ephemeris calculator that does take these factors into account. An ephemeris is the trajectory of naturally occurring astronomical objects. I downloaded the calculated distances between the Earth and Sun for each date we have data for from the HORIZON JPL website. (https://ssd.jpl.nasa.gov/horizons.cgi)
I plotted the distance from the Sun (measured in AU) and the corrected Solar irradiation from satellite data, that subtracted out the effects of sun spots.
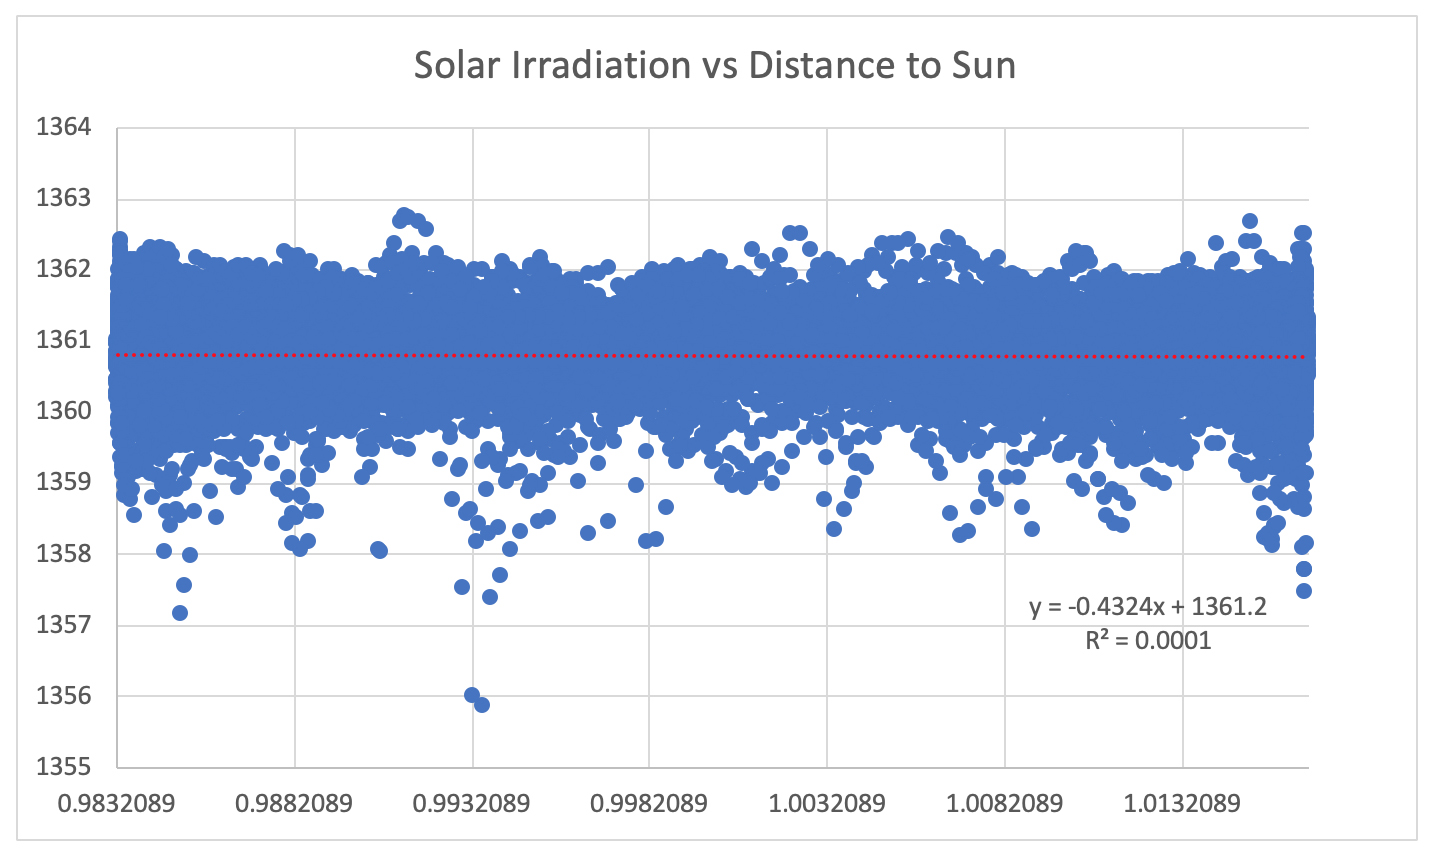
Figure: Corrected Solar Irradiation Y-Axis verses Distance from Earth to Sun (in AU) X-Axis (Daily Average)
We can plot a trend line and see what effect the distance will have. Note that the line only has a R2 value of 0.0001, which means that variation in the distance between the sun and earth is insignificantly small, and likely uncertainty or errors in calibrating the data override the effect of the Earth’s distance from the Sun.
However, if the data was more closely aligned to this linear plot, it does show a decrease of -0.4324 multiplied by the distance in AU. This is what we would expect, the farther the distance the less solar irradiation, so the line points downward, just slightly.
So the maximum distance during this period of time was 1.016782435 AU and the minimum distance during this period of time was 0.983208946 AU.
Solar Irradiation = -0.4324 (distance) + 1361.2
Solar Irradiation = -0.4324 (1.016782435) + 1361.2 = Max = 1360.760
Solar Irradiation = -0.4324 (0.983208946) + 1361.2 = Min = 1360.775
This means that the variation in the distance between the Earth and Sun only accounts for 0.015 watts per meter2 of the total yearly variation in solar irradiation. Or only 0.001%.
This is pretty insignificant over the course of 70 years.
Earth’s eccentricity is currently 0.0167, and is decreasing and will be about 0.0160 in 600 years, with an eccentricity on a 92,000-year cycle. This means that Earth’s yearly orbit around the Sun will be become more circular in the centuries to come, making the variation between maximum and minimum slightly less.
For example, Fred Espenak on his website http://www.astropixels.com/ephemeris/perap2001.html
Calculated a future perihelion of 0.9833398 AU and aphelion of 1.0167027, in the year 2100.
Hence, plugging these numbers we get:
Solar Irradiation = -0.4324 (1.0167027) + 1361.2 = Max = 1360.7603
Solar Irradiation = -0.4324 (0.9833398) + 1361.2 = Min = 1360.7748
Or 0.0145 watts per meter2, slightly less yearly variation in solar irradiation. In fact, for the next 600 years, we should expect that Earth’s eccentricity will reduce seasonal variability, but only by a small factor.
Neither a reduction in sun spot activity, nor a decrease in Earth’s eccentricity will contribute enough change in solar irradiation to successfully stem the current rising atmospheric carbon dioxide concentration in Earth’s atmosphere which have risen from 312 to 412 ppm in the last 60 years (see https://scripps.ucsd.edu/programs/keelingcurve/). Much, if not all of the rise of global temperatures is due to the increase abundance of greenhouse gases in Earth’s atmosphere, which absorb more of the sun’s energy, preventing it from returning to space. We only have to look at Venus and its atmosphere of carbon dioxide, and realize the danger Earth faces, due its changing atmosphere.
I think this paper is a call to all scientists to run their numbers more carefully, and for us all not to assume every peer-reviewed paper is correct, it may have gotten pass a few reviewers, but should not get pass the community of conscientious scientists at large.
Want to learn more, check out these very cool websites all about the new TSIS-1 satellite and learn more about Total and Spectral Solar Irradiation and how NASA measures these numbers from space!
https://www.nasa.gov/goddard/tsis-1 and check out
https://sunclimate.gsfc.nasa.gov/mission/tsis-1
[Note: I may have made some mistakes along the way, if you see any, feel free to email me.]